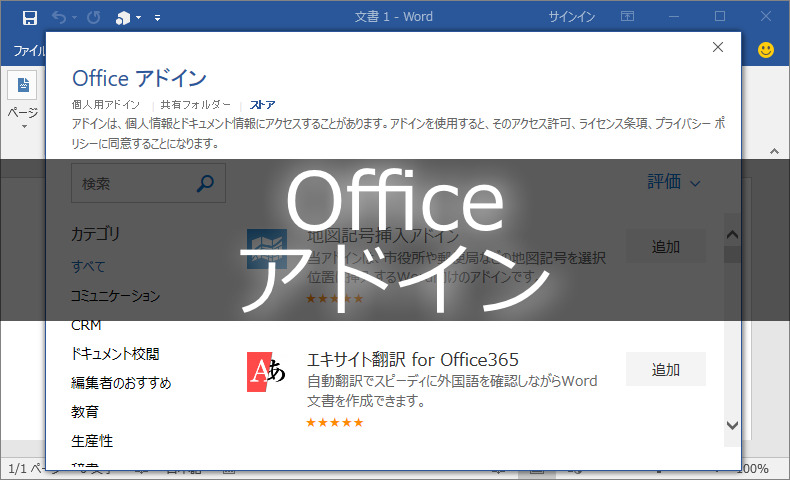
お久しぶりのOffice アドインの記事です。
注目している人はほとんどいませんが、Excel JavaScript APIのリリース予定を見れば分かる通り、Office アドインは常に進化し続けており、できることも少しずつ増えています。
今回は、「Office アドインでこんなことできるよ」という一例の紹介として、テーブルやグラフを作成してみます。
(本当はonActivatedイベントとかを試したかったのですが、2017年8月時点だとまだAPIがリリースされておらず、試すことができませんでした)
マニフェスト
※ Id要素やSourceLocation要素のDefaultValue属性の値等は適当に変更してください。
<?xml version="1.0" encoding="UTF-8"?>
<OfficeApp xmlns="http://schemas.microsoft.com/office/appforoffice/1.1" xmlns:xsi="http://www.w3.org/2001/XMLSchema-instance" xsi:type="TaskPaneApp">
  <Id>3648a44b-1eef-42fc-a713-eb78549613b8</Id>
  <Version>1.0</Version>
  <ProviderName>@kinuasa</ProviderName>
  <DefaultLocale>ja-jp</DefaultLocale>
  <DisplayName DefaultValue="Sample Add-in" />
  <Description DefaultValue="Sample Add-in"/>
  <Hosts>
    <Host Name="Workbook" />
  </Hosts>
  <AppDomains>
    <AppDomain>https://login.microsoftonline.com</AppDomain>
  </AppDomains>
  <DefaultSettings>
    <SourceLocation DefaultValue="https://localhost/sample/index.html" />
  </DefaultSettings>
  <Permissions>ReadWriteDocument</Permissions>
</OfficeApp>
コード(index.html)
<!DOCTYPE html>
<html>
  <head>
    <meta charset="UTF-8">
    <meta http-equiv="X-UA-Compatible" content="IE=Edge">
    <title>Sample</title>
    <link rel="stylesheet" href="https://static2.sharepointonline.com/files/fabric/office-ui-fabric-js/1.4.0/css/fabric.components.min.css">
    <style>
      #content-main {
        background: #ffffff;
        position: fixed;
        top: 80px;
        left: 0;
        right: 0;
        bottom: 0;
        overflow: auto;
      }
    </style>
    <script src="https://ajax.aspnetcdn.com/ajax/jquery/jquery-3.2.1.min.js"></script>
    <script src="https://appsforoffice.microsoft.com/lib/1/hosted/office.js"></script>
    <script src="https://unpkg.com/core-js/client/core.min.js"></script>
    <script src="https://unpkg.com/@microsoft/office-js-helpers@0.7.4/dist/office.helpers.min.js"></script>
    <script src="https://static2.sharepointonline.com/files/fabric/office-ui-fabric-js/1.4.0/js/fabric.min.js"></script>
    <script>
      Office.initialize = function(reason){
        $(document).ready(function(){
          $("#run").click(run);
        });
      };

      function run(){
        try{
          Excel.run(function(context){
            //const sheet = OfficeHelpers.ExcelUtilities.forceCreateSheet(context.workbook, "Sample");
            const sheet = context.workbook.worksheets.add("Sample"); //シート追加

            //テーブル作成
            const tbl = sheet.tables.add("A1:C1", true);
            tbl.getHeaderRowRange().values = [["A", "B", "C"]];
            tbl.rows.add(null, [
              [10, 20, 30],
              [11, 21, 31],
              [12, 22, 32],
              [13, 23, 33],
              [14, 24, 34],
            ]);

            //グラフ作成
            const chart = sheet.charts.add("ColumnClustered", tbl.getRange(), "Auto");
            chart.title.text = "テスト用グラフ";
            chart.setPosition("A8");
            chart.legend.position = "right"
            chart.legend.format.fill.setSolidColor("white");
            chart.dataLabels.format.font.size = 15;
            chart.dataLabels.format.font.color = "black";
            sheet.activate();
            return context.sync();
          }).then(function(){
            OfficeHelpers.UI.notify("", "Success", "success");
          });
        }catch(error){
          OfficeHelpers.UI.notify(error);
        }
      }
    </script>
  </head>
  <body>
    <div id="content-main">
      <button id="run" class="ms-Button">
        <span class="ms-Button-label">Run Code</span>
      </button>
    </div>
  </body>
</html>
実行画面
アドインを読み込んで「Run Code」ボタンをクリックすると、「Sample」シートが追加され、シート上にテーブルとグラフが作成されます。
Web連携を得意とするOffice アドインでWeb上のデータを取り込み、Excelシートにグラフとして出力して視覚化する等、グラフが作成できるだけでも、Office アドインを活用し得る場面は多々あると思います。
関連Webページ
- 最初の Excel アドインをビルドする
- https://msdn.microsoft.com/ja-jp/library/office/mt616491.aspx
- Office UI Fabric JS
- https://dev.office.com/fabric-js/index.html
- Excel JavaScript API requirement sets
- https://github.com/OfficeDev/office-js-docs/blob/ExcelJs_OpenSpec/reference/requirement-sets/excel-api-requirement-sets.md
- Excel JavaScript API Open Specification
- https://github.com/OfficeDev/office-js-docs/tree/ExcelJs_OpenSpec
- Worksheet Object (JavaScript API for Excel)
- https://github.com/OfficeDev/office-js-docs/blob/ExcelJs_OpenSpec/reference/excel/worksheet.md
- Range Object (JavaScript API for Excel)
- https://github.com/OfficeDev/office-js-docs/blob/ExcelJs_OpenSpec/reference/excel/range.md
- ChartCollection Object (JavaScript API for Excel)
- https://github.com/OfficeDev/office-js-docs/blob/master/reference/excel/chartcollection.md
- ChartCollection オブジェクト (JavaScript API for Excel)
- https://github.com/OfficeDev/office-js-docs.ja-JP/blob/live/reference/excel/chartcollection.md


この記事へのコメントはありません。